Plotting graphs
Long time ago I decided to monitor temperature of RPi`s CPU, CPU load, outside temperature... Collecting data is quite simple, but it wanted some graphical representation. After short searching I found two programs - RRDTool and GnuPlot. RRDTool is maybe more adjusted for graphical representation of statistics, while GnuPlot is more suitable for mathematical functions. But I like GnuPlot`s graphs more :)
Monitoring CPU temperature
To print actual temperature of CPU can be used this command:
vcgencmd measure_temp
Output is in this format:
temp=44.4'C
This can not be used by GnuPlot. We have to cut needless characters.
vcgencmd measure_temp | cut -d'=' -f2 | cut -d"'" -f1
Now the output is:
44.4
Now we need to run this command in loop to get information on how temperature change in time. Also temperature need to be paired with actual time to let GnuPlot know when was the temperature taken. For this I created simple bash script. First, create new file:
touch get_temp.sh
...make it executable...
chmod +x get_temp.sh
Edit this file:
nano get_temp.sh
And paste this script:
#!/bin/bash
while :
do
temp=`vcgencmd measure_temp | cut -d'=' -f2 | cut -d"'" -f1`
echo "`date +"%d-%m %H:%M:%S"` $temp" >> temp.dat
sleep 100
done
Number in bold black is number of seconds between measurements. Now you can run this script in background.
./get_temp.sh &
There will be a new file "temp.dat" containing complete temerature history. Because this file is containing complete history, before creating a graph, you have to make another file containing only temperatures from a single day. We can use a little advanced "grep" command.
grep `date --date='1 days ago' +"\%d-\%m"` < /path/to/temp.dat > /path/to/temperature_temporary.dat
Do not forget to change path. This command will copy temperatures from previous day and paste them in new "temperature_temporary.dat" file. It was a long way, but now you have file with temperatures from previous day in format that GnuPlot can understand. Before you can try to plot first graph you have to insall "gnuplot" package.
apt-get install gnuplot
Now create a new file "temperature.sh" and make it executable and edit...
touch temperature.sh
chmod +x tempereture.sh
nano temperature.sh
Paste this. It is configuration for GnuPlot.
#!/usr/bin/gnuplot
set terminal png #output format of graph
set term pngcairo size 800,600 #resolution
set output "temp_`date --date='1 days ago' +"%Y%m%d"`.png" #name of output file
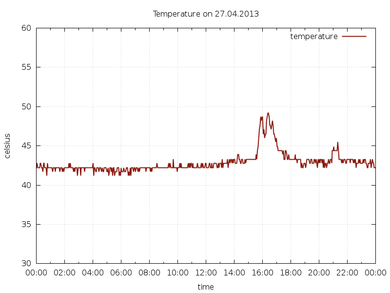
set title "Temperature on `date --date='1 days ago' +"%d.%m.%Y"`" #title of graph
set xlabel "time" #horizontal axis name
set ylabel "celsius" #vertical axis name
set yrange [30:60] #vertical axis range (optional line)
set xdata time #x axis is not numbers, but dates/times
set timefmt "%d-%m %H:%M:%S" #format of time is source file (temperature_temporary.dat)
set format x "%H:%M" #format of time labels in axis label
set grid xtics lc rgb "#888888" lw 1 lt 0 #grey grid on background
set grid ytics lc rgb "#888888" lw 1 lt 0 #grey grid on background
plot "temperature_temporary.dat" using 1:3 title "temperature" with lines lc rgb '#8b1a0e' lt 1 lw 2
#source file, color of line
This scripts are ideal to use for daily plotting of temperature graph. So add these scripts to crontab.
crontab -e
And add following lines:
#start gathering data at startup
@reboot cd /path && ./get_temp.sh
#everyday 20 minutes after midnight copy yesterday measurements to temporary file
20 0 * * * grep `date --date='1 days ago' +"\%d-\%m"` < /path/temperature.dat > /path/temperature_temporary.dat
#everyday at 00:25 plot graph
25 0 * * * cd /path && ./temperature.sh
Now close file (CTRL+X...) and save changes (...press "y" and Enter). For changes to take effect, restart RPi.
reboot
From now, everyday at 00:25 will be created nice graph with temperatures from previous day. Good idea is to place this graphs in webserver folder with enabled autoindex.
Higher temperature at 16-17:00 is caused by sun shining directly on black SoC through window.
